Requirement:
A relatively “large scale” environment (500-1000 servers) needs to be monitored, with specific KPIs tracked and trended at regular intervals. This needs to be done without adding extra packages to the current production servers, which may have only basic unix tools/commands available.
There can be no impact…zero…none to the performance of the server as some of them already have a high workload.
The collected data needs to be relatively easy to ingest, so that time and effort is maximized. Ideally, data collection should be automated and require zero human interaction.
Setup
I plan to use Elasticsearch for this task. I already know it well and am envisioning this working at a high level in these stages (note: I am not using any beats for this task. Even though they are extremely light weight, I would need a soak period proven before deploying and metricbeat in particular tends to create large indices, which for me is excessive as I can boil down the operational needs to no more than two dozen KPIs per server):
- cronjob on a jumpbox kicks off a script (at regular intervals) which executes a script over ssh to collect the required KPIs, which are output to specific log files on the jumpbox sorted by something like
hostname–date-.log. Neither the script nor the output remain on the production server. - filebeat will run on the jumpbox, collecting the output as soon as it’s available and sending it to logstash for ingest.
- Ingest on the logstash node will be relatiely straight forward as the collected logs will always be in the same format (pipe deliminated). Any values missing will need to be skipped and recorded as a null.
The two areas requiring the most effort will be the KPI collection script itself and the grok pattern to parse the logs (as it needs to be resilient to any nulls).
Prep Script
This is where you need to decide how you want to collect the data. Personally, I prefer something like counters/values in a predictable format that I can synthesize later. I’ve done this kind of collection using internal DBs (pdb) and SNMP, as well as grep’in and awk’in through logs. For availability and simplicity, I’ll focus on SNMP based collection locally. I’m doing this locally as I won’t allow (via firewalld) external SNMP access for polling for security reasons.
If not already done, I’d need net-snmp running, which the below accomplishes. I am approaching this under the assumption it already is:
yum -y install net-snmp net-snmp-utils; systemctl enable snmpd; systemctl start snmpd
Next, we need to expose the relevant OIDs for data collection. Considering I have a high number (hundreds) of these to set up, I am scripting the snmpd.conf update to pull from a list of IPs/Hostnames:
The script / series of commands in this example are simply adding the required MIBs to snmpd.conf and reloading snmpd.service.
#!/bin/bash

HOSTNAME=`hostname`

echo ""
echo "##########################################"
echo "backing up snmpd.conf and updating OIDs..."
cp /etc/snmp/snmpd.conf /etc/snmp/snmpd.conf.`date +"%Y_%m_%d-%H:%M:%S"`.bk


echo "" >> /etc/snmp/snmpd.conf
echo "########################" >> /etc/snmp/snmpd.conf
echo "# added by Operations #" >> /etc/snmp/snmpd.conf
echo "########################" >> /etc/snmp/snmpd.conf
echo "" >> /etc/snmp/snmpd.conf
echo "#IF-MIB::interfaces" >> /etc/snmp/snmpd.conf
echo view systemview included .1.3.6.1.2.1.2 >> /etc/snmp/snmpd.conf
echo "#IP-MIB::ip" >> /etc/snmp/snmpd.conf
echo view systemview included .1.3.6.1.2.1.4 >> /etc/snmp/snmpd.conf
echo "#TCP-MIB::tcp" >> /etc/snmp/snmpd.conf
echo view systemview included .1.3.6.1.2.1.6 >> /etc/snmp/snmpd.conf
echo "#UDP-MIB::udp" >> /etc/snmp/snmpd.conf
echo view systemview included .1.3.6.1.2.1.7 >> /etc/snmp/snmpd.conf
echo "#HOST-RESOURCES-MIB::" >> /etc/snmp/snmpd.conf
echo view systemview included .1.3.6.1.2.1.25 >> /etc/snmp/snmpd.conf
echo "#UCD-SNMP-MIB::" >> /etc/snmp/snmpd.conf
echo view systemview included .1.3.6.1.4.1.2021 >> /etc/snmp/snmpd.conf

echo ""
echo "...reloading snmpd and checking snmpd status..."
systemctl reload snmpd
echo ""
systemctl status snmpd |grep Active |awk '{print $2}'
echo ""
echo "SNMP setup is complete for $HOSTNAME!"
echo "##########################################"
echo ""
To launch this script I’m using the below which reads from /var/tmp/service-list.txt, which is a long list of server IPs. The awk will skip any blank or commented lines. ssh is replying on ssh keys which are already setup for this user.
#!/bin/bash

i=1
cat /var/tmp/server-list.txt |awk '!/^ *#/ && NF' |while read serverList
do
array[ $i ]="$serverList"
(( i++ ))
ssh user@$serverList "bash -s" < /var/tmp/snmp-setup.sh >>/var/tmp/SNMP-Setup_`date +"%Y-%m-%d_%H:%M"`.log
done

echo "Finished checking every server in the list!"
Now for a test run:
[user@jumpbox tmp]# ./snmp-kickoff.sh
Finished checking every server in the list!

[user@jumpboxtmp]# cat SNMP-Setup_2019-10-15_16:11.log

##########################################
backing up snmpd.conf and updating OIDs...

...reloading snmpd and checking snmpd status...

active

SNMP setup is complete for server1.example.net!
##########################################


##########################################
backing up snmpd.conf and updating OIDs...

...reloading snmpd and checking snmpd status...

active

SNMP setup is complete for server2.example.net!
##########################################


##########################################
backing up snmpd.conf and updating OIDs...

...reloading snmpd and checking snmpd status...

active

SNMP setup is complete for server3.example.net!
##########################################
Data Collection
The data collection script will use the same server list as the snmp-kickoff script, which preps each server with the correct snmpd configuration.
The logic is that the script only needs to execute a minimal number of commands (4 snmpwalks plus a cat of /proc/meminfo as it’s the most accurate). The value of the data is then grep’d through for the KPIs I want. I can add more KPIs if need be, without adding any additional command execution.
#!/bin/bash
#dberry was here
###Commands reference###
HOSTNAME=`hostname`
###Reference for CPU load averages###
CPULOADAVG=`snmpwalk -cpublic -v2c localhost UCD-SNMP-MIB::laTable`
#1 min load average
CPU1MINAVG=`echo “$CPULOADAVG” |grep laLoad.1 |awk ‘{print $4}’`
#5 min load average
CPU5MINAVG=`echo “$CPULOADAVG” |grep laLoad.2 |awk ‘{print $4}’`
#15 min load average
CPU15MINAVG=`echo “$CPULOADAVG” |grep laLoad.3 |awk ‘{print $4}’`
###Reference for CPU system stats table###
CPUSYSTEMSTATS=`snmpwalk -cpublic -v2c localhost UCD-SNMP-MIB::systemStats`
#CPU user and system utilization percent
CPUUSERPERCENT=`echo “$CPUSYSTEMSTATS” |grep ssCpuUser.0 |awk ‘{print $4}’`
CPUSYSTEMPERCENT=`echo “$CPUSYSTEMSTATS” |grep ssCpuSystem.0 |awk ‘{print $4}’`
#CPU idle percent
CPUIDLEPERCENT=`echo “$CPUSYSTEMSTATS” |grep ssCpuIdle.0 |awk ‘{print $4}’`
###Reference for Memory Stats###
MEMORYSTATS=`cat /proc/meminfo`
#MemTotal and Available
MEMTOTAL=`echo “$MEMORYSTATS” |grep MemTotal |awk ‘{print $2}’`
MEMAVAILABLE=`echo “$MEMORYSTATS” |grep MemAvailable |awk ‘{print $2}’`
MEMACTIVE=`echo “$MEMORYSTATS” |grep Active |egrep -v ‘(anon|file)’ |awk ‘{print $2}’`
#SwapTotal and Available
SWAPTOTAL=`echo “$MEMORYSTATS” |grep SwapTotal |awk ‘{print $2}’`
SWAPFREE=`echo “$MEMORYSTATS” |grep SwapFree |awk ‘{print $2}’`
#Filesystem and Disk
#HOST-RESOURCES-MIB::hrStorageAllocationUnits.31 = INTEGER: 4096 Bytes <- This is important
ROOTPARTITIONSIZE=`snmpget -cpublic -v2c localhost hrStorageSize.31 |awk ‘{print $4}’`
ROOTPARTITIONUSED=`snmpget -cpublic -v2c localhost hrStorageUsed.31 |awk ‘{print $4}’`
###Reference for disk IO stats###
DISKIOSTATS=`snmpwalk -cpublic -v2c localhost UCD-DISKIO-MIB::diskIOTable`
#1,5 and 15 mins disk load averages
ROOT1MINLOADAVG=`echo “$DISKIOSTATS” |grep diskIOLA1.1 |awk ‘{print $4}’`
ROOT5MINLOADAVG=`echo “$DISKIOSTATS” |grep diskIOLA5.1 |awk ‘{print $4}’`
ROOT15MINLOADAVG=`echo “$DISKIOSTATS” |grep diskIOLA15.1 |awk ‘{print $4}’`
###Reference for Interface stats from IF-MIB::ifTable###
INTERFACESTATS=`snmpwalk -cpublic -v2c localhost IF-MIB::ifTable`
ETH0IFINOCTETS=`echo “$INTERFACESTATS” |grep ifInOctets.2 |awk ‘{print $4}’`
ETH0IFOUTOCTETS=`echo “$INTERFACESTATS” |grep ifOutOctets.2 |awk ‘{print $4}’`
ETH0INDISCARDS=`echo “$INTERFACESTATS” |grep ifInDiscards.2 |awk ‘{print $4}’`
ETH0OUTDISCARDS=`echo “$INTERFACESTATS” |grep ifOutDiscards.2 |awk ‘{print $4}’`
ETH0INERRORS=`echo “$INTERFACESTATS” |grep ifInErrors.2 |awk ‘{print $4}’`
ETH0OUTERRORS=`echo “$INTERFACESTATS” |grep ifOutErrors.2 |awk ‘{print $4}’`
echo “HOSTNAME:$HOSTNAME|CPU1MINAVG:$CPU1MINAVG|CPU5MINAVG:$CPU5MINAVG|CPU15MINAVG:$CPU15MINAVG|CPUUSERPERCENT:$CPUUSERPERCENT|CPUSYSTEMPERCENT:$CPUSYSTEMPERCENT|CPUIDLEPERCENT:$CPUIDLEPERCENT|MEMTOTAL:$MEMTOTAL|MEMAVAILABLE:$MEMAVAILABLE|MEMACTIVE:$MEMACTIVE|SWAPTOTAL:$SWAPTOTAL|SWAPFREE:$SWAPFREE|ROOTPARTITIONSIZE:$ROOTPARTITIONSIZE|ROOTPARTITIONUSED:$ROOTPARTITIONUSED|ROOT1MINLOADAVG:$ROOT1MINLOADAVG|ROOT5MINLOADAVG:$ROOT5MINLOADAVG|ROOT15MINLOADAVG:$ROOT15MINLOADAVG|ETH0IFINOCTETS:$ETH0IFINOCTETS|ETH0IFOUTOCTETS:$ETH0IFOUTOCTETS|ETH0INDISCARDS:$ETH0INDISCARDS|ETH0OUTDISCARDS:$ETH0OUTDISCARDS|ETH0INERRORS:$ETH0INERRORS|ETH0OUTERRORS:$ETH0OUTERRORS”
The result is then echo’d out in a pipe deliminated format, which I plan to parse in Logstash for use in Elastic.
Example:
[user@dhcp tmp]# ./kpiCollection.sh
HOSTNAME:dhcp.example.net|CPU1MINAVG:0.00|CPU5MINAVG:0.01|CPU15MINAVG:0.05|CPUUSERPERCENT:0|CPUSYSTEMPERCENT:0|CPUIDLEPERCENT:98|MEMTOTAL:500180|MEMAVAILABLE:323708|MEMACTIVE:176056|SWAPTOTAL:421884|SWAPFREE:420056|ROOTPARTITIONSIZE:677376|ROOTPARTITIONUSED:403109|ROOT1MINLOADAVG:0|ROOT5MINLOADAVG:0|ROOT15MINLOADAVG:0|ETH0IFINOCTETS:3043965952|ETH0IFOUTOCTETS:9373054|ETH0INDISCARDS:1|ETH0OUTDISCARDS:0|ETH0INERRORS:0|ETH0OUTERRORS:0
[user@dhcp tmp]#
Now, let’s work this into a kickoff script that will read through the server list so I can launch the script from one point (jumpbox or centralized log ingest node) and collect everything over ssh.
#!/bin/bash
# if you need debugging, uncomment the below
#set -x
i=1
cat /var/tmp/server-list.txt |awk ‘!/^ *#/ && NF’ |while read serverList
do
array[ $i ]=”$serverList”
(( i++ ))
ssh root@$serverList “bash -s” < /var/tmp/kpiCollection.sh >>/var/tmp/KPI_`date +”%Y-%m-%d_%H:%M”`.log
done
echo “Finished KPI collection for every server in the list!”
Example:
[user@puppetmaster tmp]# ./kpi-kickoff.sh
Finished KPI collection for every server in the list!
[user@puppetmaster tmp]#
[user@puppetmaster tmp]# ls -l KPI*
-rw-r--r--. 1 user user 1304 Oct 17 15:09 KPI_2019-10-17_15:09.log
[user@puppetmaster tmp]#
[user@puppetmaster tmp]# tail KPI_2019-10-17_15:09.log
HOSTNAME:ns1.example.net|CPU1MINAVG:0.49|CPU5MINAVG:0.47|CPU15MINAVG:0.27|CPUUSERPERCENT:0|CPUSYSTEMPERCENT:0|CPUIDLEPERCENT:99|MEMTOTAL:500180|MEMAVAILABLE:322484|MEMACTIVE:196420|SWAPTOTAL:421884|SWAPFREE:410332|ROOTPARTITIONSIZE:677376|ROOTPARTITIONUSED:438912|ROOT1MINLOADAVG:0|ROOT5MINLOADAVG:0|ROOT15MINLOADAVG:0|ETH0IFINOCTETS:3315204668|ETH0IFOUTOCTETS:600135194|ETH0INDISCARDS:1|ETH0OUTDISCARDS:0|ETH0INERRORS:0|ETH0OUTERRORS:0
HOSTNAME:dhcp.example.net|CPU1MINAVG:0.00|CPU5MINAVG:0.01|CPU15MINAVG:0.05|CPUUSERPERCENT:0|CPUSYSTEMPERCENT:0|CPUIDLEPERCENT:99|MEMTOTAL:500180|MEMAVAILABLE:321700|MEMACTIVE:177664|SWAPTOTAL:421884|SWAPFREE:420056|ROOTPARTITIONSIZE:677376|ROOTPARTITIONUSED:402735|ROOT1MINLOADAVG:0|ROOT5MINLOADAVG:0|ROOT15MINLOADAVG:0|ETH0IFINOCTETS:3044963814|ETH0IFOUTOCTETS:9379091|ETH0INDISCARDS:1|ETH0OUTDISCARDS:0|ETH0INERRORS:0|ETH0OUTERRORS:0
HOSTNAME:lamp.example.net|CPU1MINAVG:0.00|CPU5MINAVG:0.01|CPU15MINAVG:0.05|CPUUSERPERCENT:0|CPUSYSTEMPERCENT:0|CPUIDLEPERCENT:99|MEMTOTAL:500180|MEMAVAILABLE:203228|MEMACTIVE:111816|SWAPTOTAL:946172|SWAPFREE:909404|ROOTPARTITIONSIZE:1857024|ROOTPARTITIONUSED:1230849|ROOT1MINLOADAVG:0|ROOT5MINLOADAVG:0|ROOT15MINLOADAVG:0|ETH0IFINOCTETS:667351072|ETH0IFOUTOCTETS:5467449|ETH0INDISCARDS:0|ETH0OUTDISCARDS:0|ETH0INERRORS:0|ETH0OUTERRORS:0
[user@puppetmaster tmp]#
Scheduled in crontab. Hourly will work for now.
0 * * * * /var/tmp/kpi-kickoff.sh
Now that we have regular data to ingest, let’s parse this in Logstash using grok and regex:
Parsing pipe deliminated lines
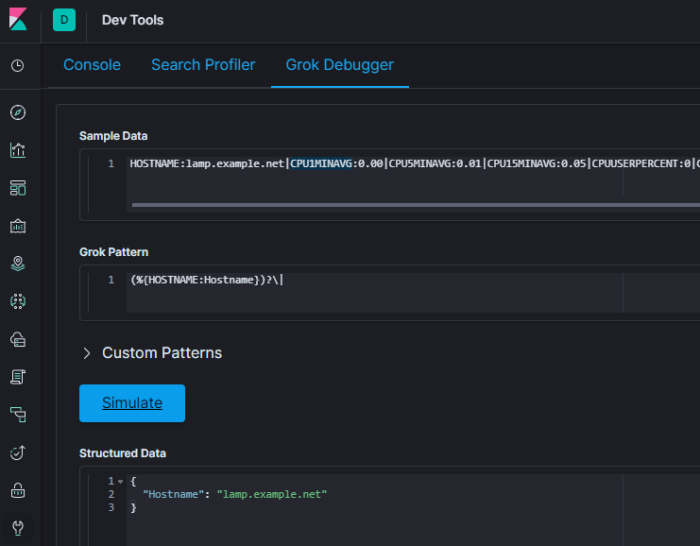
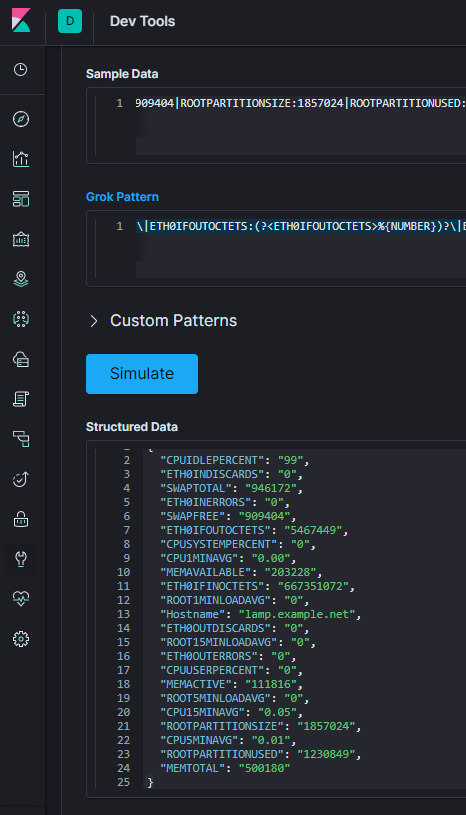
For this task you can either use https://grokdebug.herokuapp.com/ or the Grok Debugger under the Dev Tools in Kibana.
One thing to keep in mind while building up a grok filter, is how it will behave if a value is missing/null.
First, place a single line in the sample data. I’m using the one below:
HOSTNAME:lamp.example.net|CPU1MINAVG:0.00|CPU5MINAVG:0.01|CPU15MINAVG:0.05|CPUUSERPERCENT:0|CPUSYSTEMPERCENT:0|CPUIDLEPERCENT:99|MEMTOTAL:500180|MEMAVAILABLE:203228|MEMACTIVE:111816|SWAPTOTAL:946172|SWAPFREE:909404|ROOTPARTITIONSIZE:1857024|ROOTPARTITIONUSED:1230849|ROOT1MINLOADAVG:0|ROOT5MINLOADAVG:0|ROOT15MINLOADAVG:0|ETH0IFINOCTETS:667351072|ETH0IFOUTOCTETS:5467449|ETH0INDISCARDS:0|ETH0OUTDISCARDS:0|ETH0INERRORS:0|ETH0OUTERRORS:0
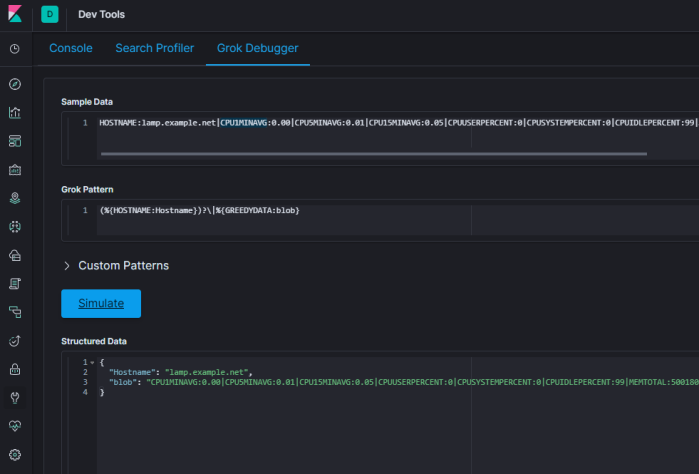
Then build up your pattern.
If you hit a snag and things don’t parse, use greedydata to see what is coming next (this can be very helpful if you are working with an output with missing / null fields.
For the load averages, I’ll match those to a digit plus one or more decimal places:
(?<value name>[\d\.]+)
or:
(?<value name>%{BASE10NUM})
Any parenthesis enclosed pattern can be skipped if null by placing a ? after it. This keeps your whole line from becoming a grok parse failure if there are nulls.
(?<value name>[\d\.]+)?
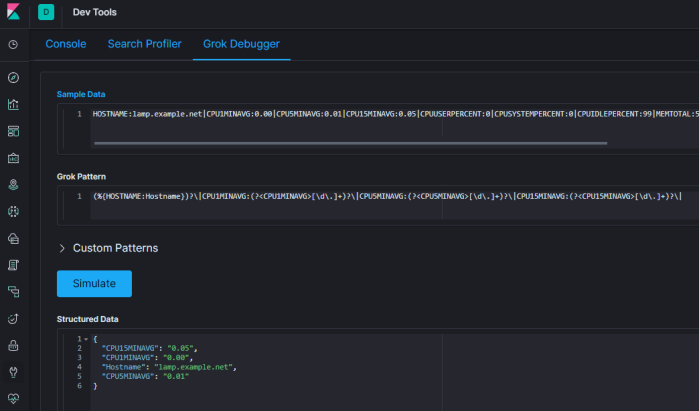
Here is one possible grok pattern that matches the example output (I switched the CPU load averages to the grok pattern of BASE10NUM as they would never end up a number such as 10.12.233 which the regex [\d\.]+ would be good for.
(%{HOSTNAME:Hostname})?\|CPU1MINAVG:(?<CPU1MINAVG>%{BASE10NUM})?\|CPU5MINAVG:(?<CPU5MINAVG>%{BASE10NUM})?\|CPU15MINAVG:(?<CPU15MINAVG>%{BASE10NUM})?\|CPUUSERPERCENT:(?<CPUUSERPERCENT>%{NUMBER})?\|CPUSYSTEMPERCENT:(?<CPUSYSTEMPERCENT>%{NUMBER})?\|CPUIDLEPERCENT:(?<CPUIDLEPERCENT>%{NUMBER})?\|MEMTOTAL:(?<MEMTOTAL>%{NUMBER})?\|MEMAVAILABLE:(?<MEMAVAILABLE>%{NUMBER})?\|MEMACTIVE:(?<MEMACTIVE>%{NUMBER})?\|SWAPTOTAL:(?<SWAPTOTAL>%{NUMBER})?\|SWAPFREE:(?<SWAPFREE>%{NUMBER})?\|ROOTPARTITIONSIZE:(?<ROOTPARTITIONSIZE>%{NUMBER})?\|ROOTPARTITIONUSED:(?<ROOTPARTITIONUSED>%{NUMBER})?\|ROOT1MINLOADAVG:(?<ROOT1MINLOADAVG>%{NUMBER})?\|ROOT5MINLOADAVG:(?<ROOT5MINLOADAVG>%{NUMBER})?\|ROOT15MINLOADAVG:(?<ROOT15MINLOADAVG>%{NUMBER})?\|ETH0IFINOCTETS:(?<ETH0IFINOCTETS>%{NUMBER})?\|ETH0IFOUTOCTETS:(?<ETH0IFOUTOCTETS>%{NUMBER})?\|ETH0INDISCARDS:(?<ETH0INDISCARDS>%{NUMBER})?\|ETH0OUTDISCARDS:(?<ETH0OUTDISCARDS>%{NUMBER})?\|ETH0INERRORS:(?<ETH0INERRORS>%{NUMBER})?\|ETH0OUTERRORS:(?<ETH0OUTERRORS>%{NUMBER})?
Other useful tricks:
Spaces
If you have any spaces between your values, if you use %{SPACE} it will account for that gap whether it’s one space or ten spaces.
Example:
HOSTNAME:lamp.example.net| |CPU1MINAVG:0.00|
is parsed by:
(%{HOSTNAME:Hostname})?\|%{SPACE}\|CPU1MINAVG:(?<CPU1MINAVG>%{BASE10NUM})?\
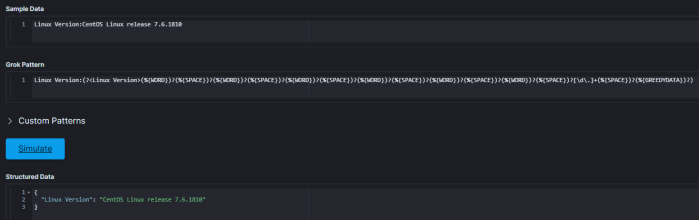
Multiple Possible Words and Versions
Parsing something like “CentOS Linux release 7.6.1810” is possible with the below grok:
%{WORD}%{SPACE}%{WORD}%{SPACE}%{WORD}%{SPACE}[\d\.]+
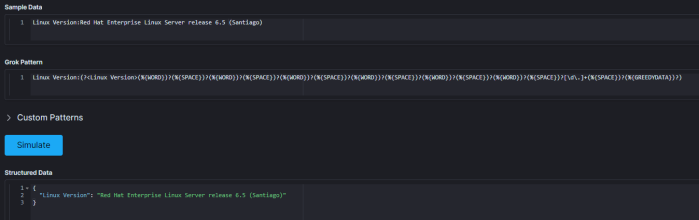
However, what if the output isn’t exactly the same? If this were a red hat box, you might get the below (from /etc/redhat-release) instead:
“Red Hat Enterprise Linux Server release 6.5 (Santiago)”
In which case your grok needs to actually be something like:
%{WORD}%{SPACE}%{WORD}%{SPACE}%{WORD}%{SPACE}%{WORD}%{SPACE}%{WORD}%{SPACE}%{WORD}%{SPACE}[\d\.]+%{SPACE}%{GREEDYDATA}
So how can we make our grok robust enough to account for either scenario/output? By enclosing each grok pattern within parenthesis followed by a question mark, but leaving the [\d\.]+ for the release version “as is” so it’s required, we’ll match any number of words up to the total possible, before the digits.
Example:
(%{WORD})?(%{SPACE})?(%{WORD})?(%{SPACE})?(%{WORD})?(%{SPACE})?(%{WORD})?(%{SPACE})?(%{WORD})?(%{SPACE})?(%{WORD})?(%{SPACE})?[\d\.]+(%{SPACE})?(%{GREEDYDATA})?
For reference here is a full list of all the grok patterns:
https://github.com/logstash-plugins/logstash-patterns-core/blob/master/patterns/grok-patterns
There are built on Oniguruma Regular Expressions:
https://github.com/kkos/oniguruma/blob/master/doc/RE
For regex, here’s a handy quick reference:
https://www.rexegg.com/regex-quickstart.html
Sending data to Logstash
Now that my jumpbox is collecting KPI’s from the list of servers provided, I need a reliable way to send them to Logstash for ingest. For this I’ll use filebeat. Here’s the configuration, it’s very simple:
filebeat.inputs:
- type: log
enabled: true
index: "logfiles"
tail_files: true
paths:
- /var/tmp/KPI*.log

processors:
- drop_fields:
fields: ["prospector", "offset"]

output.logstash:
hosts: ["192.168.xxx.xx:5000"]
on the Logstash side, here is the pipeline:
input {
beats {
port => 5000
type => "kpis"
}
}

filter {
if [type] == "kpis" {
grok {
match => {
"message" => [ "(%{HOSTNAME:Hostname})?\|CPU1MINAVG:(?<CPU1MINAVG>%{BASE10NUM})?\|CPU5MINAVG:(?<CPU5MINAVG>%{BASE10NUM})?\|CPU15MINAVG:(?<CPU15MINAVG>%{BASE10NUM})?\|CPUUSERPERCENT:(?<CPUUSERPERCENT>%{NUMBER})?\|CPUSYSTEMPERCENT:(?<CPUSYSTEMPERCENT>%{NUMBER})?\|CPUIDLEPERCENT:(?<CPUIDLEPERCENT>%{NUMBER})?\|MEMTOTAL:(?<MEMTOTAL>%{NUMBER})?\|MEMAVAILABLE:(?<MEMAVAILABLE>%{NUMBER})?\|MEMACTIVE:(?<MEMACTIVE>%{NUMBER})?\|SWAPTOTAL:(?<SWAPTOTAL>%{NUMBER})?\|SWAPFREE:(?<SWAPFREE>%{NUMBER})?\|ROOTPARTITIONSIZE:(?<ROOTPARTITIONSIZE>%{NUMBER})?\|ROOTPARTITIONUSED:(?<ROOTPARTITIONUSED>%{NUMBER})?\|ROOT1MINLOADAVG:(?<ROOT1MINLOADAVG>%{NUMBER})?\|ROOT5MINLOADAVG:(?<ROOT5MINLOADAVG>%{NUMBER})?\|ROOT15MINLOADAVG:(?<ROOT15MINLOADAVG>%{NUMBER})?\|ETH0IFINOCTETS:(?<ETH0IFINOCTETS>%{NUMBER})?\|ETH0IFOUTOCTETS:(?<ETH0IFOUTOCTETS>%{NUMBER})?\|ETH0INDISCARDS:(?<ETH0INDISCARDS>%{NUMBER})?\|ETH0OUTDISCARDS:(?<ETH0OUTDISCARDS>%{NUMBER})?\|ETH0INERRORS:(?<ETH0INERRORS>%{NUMBER})?\|ETH0OUTERRORS:(?<ETH0OUTERRORS>%{NUMBER})?"
]
}
}
}
mutate {
remove_field => ["message", "tags"]
}
}

output {
elasticsearch {
hosts => [ "192.168.xxx.xx:9200" ]
index => "kpis-%{+YYYY.MM.dd}"
}
stdout { codec => rubydebug }
}
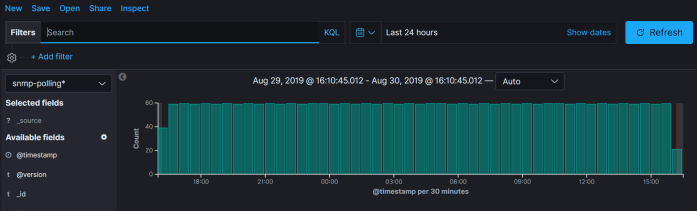
journalctl -f -u logstash can be used to confirm the data is received and parsed:
Oct 17 22:00:11 Logstash.example.net logstash[2025]: "ETH0INDISCARDS" => "0",
Oct 17 22:00:11 Logstash.example.net logstash[2025]: "CPUIDLEPERCENT" => "99",
Oct 17 22:00:11 Logstash.example.net logstash[2025]: "SWAPFREE" => "909404",
Oct 17 22:00:11 Logstash.example.net logstash[2025]: "ETH0IFINOCTETS" => "693246286",
Oct 17 22:00:11 Logstash.example.net logstash[2025]: "ETH0OUTERRORS" => "0",
Oct 17 22:00:11 Logstash.example.net logstash[2025]: "type" => "KPIs"
Oct 17 22:00:11 Logstash.example.net logstash[2025]: }
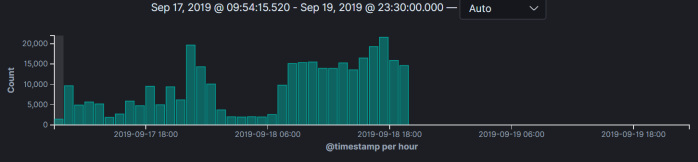
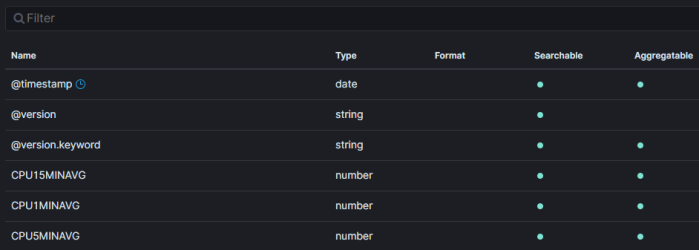
The data should now be discover-able in kibana after you create the index pattern to match “kpis*”:
Let’s Visualize
Before we go any further, we have to figure out how we want to work with the data collected. With a raw data ingest such as this, unless we set up a mapping template, the data will be stored as a text doc. You can still search for strings based on the foobar.keyword syntax, but you can’t plot averages and counts.

What we need to do is create a mapping template for the kpis* index pattern that converts these values to the correct numeric equivalent.
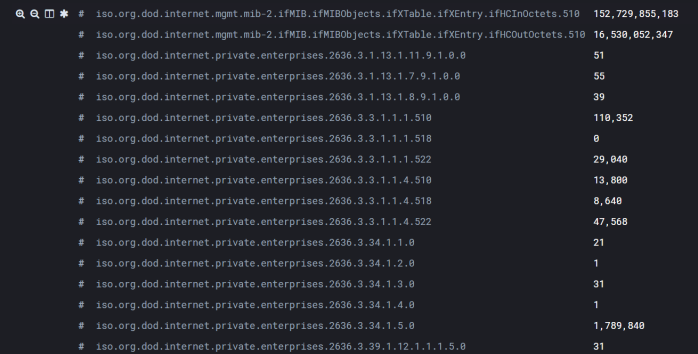
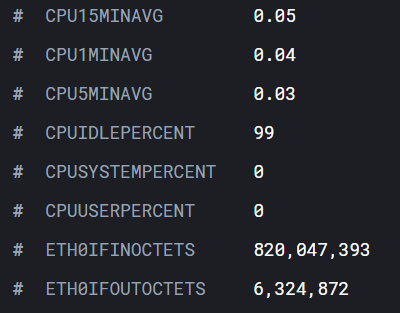
Consider the raw data. We can see this from discovering it via the index pattern itself:

Converting this to a float type would make sense. For reference, here are the types: https://www.elastic.co/guide/en/elasticsearch/reference/current/mapping-types.html
Luckily, in the dev tools of kibana, it’s super easy to create an index mapping template. You can view your current templates with GET _cat/templates and examine individual templates with something like GET _template/logstash.
Using the below, I am now converting the CPU load average values to floats:
PUT _template/kpis
{
"index_patterns": [
"kpis*"
],
"mappings": {
"properties": {
"CPU15MINAVG": {
"type": "float"
},
"CPU5MINAVG": {
"type": "float"
},
"CPU1MINAVG": {
"type": "float"
}
}
}
}
Once this is done, you’ll need re-create the index pattern and drop any old indexes as once the data is indexed, it’s staying that way.
Here’s an example of a index template that would work for the above:
{
"kpis" : {
"order" : 0,
"index_patterns" : [
"kpis*"
],
"settings" : { },
"mappings" : {
"properties" : {
"CPUIDLEPERCENT" : {
"type" : "integer"
},
"ETH0INDISCARDS" : {
"type" : "integer"
},
"ROOT1MINLOADAVG" : {
"type" : "float"
},
"SWAPTOTAL" : {
"type" : "integer"
},
"ETH0OUTDISCARDS" : {
"type" : "integer"
},
"ETH0INERRORS" : {
"type" : "integer"
},
"ETH0OUTERRORS" : {
"type" : "integer"
},
"ROOT15MINLOADAVG" : {
"type" : "float"
},
"CPUUSERPERCENT" : {
"type" : "integer"
},
"ETH0IFOUTOCTETS" : {
"type" : "long"
},
"SWAPFREE" : {
"type" : "integer"
},
"CPUSYSTEMPERCENT" : {
"type" : "integer"
},
"MEMACTIVE" : {
"type" : "integer"
},
"ROOT5MINLOADAVG" : {
"type" : "float"
},
"CPU15MINAVG" : {
"type" : "float"
},
"CPU1MINAVG" : {
"type" : "float"
},
"MEMAVAILABLE" : {
"type" : "integer"
},
"ROOTPARTITIONSIZE" : {
"type" : "integer"
},
"CPU5MINAVG" : {
"type" : "float"
},
"ETH0IFINOCTETS" : {
"type" : "long"
},
"ROOTPARTITIONUSED" : {
"type" : "integer"
},
"MEMTOTAL" : {
"type" : "integer"
}
}
},
"aliases" : { }
}
}
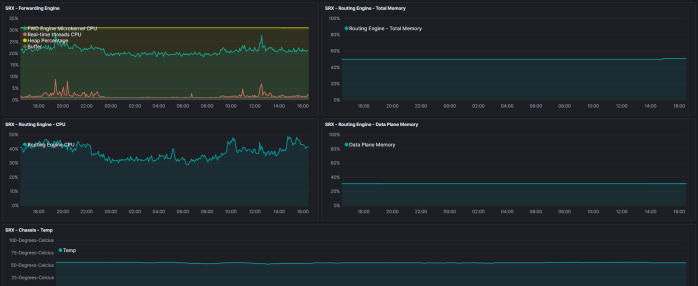
That’s better:
I also pointed something out in the data collection script that we need to consider when visualizing:
#HOST-RESOURCES-MIB::hrStorageAllocationUnits.31 = INTEGER: 4096 Bytes
If the data/kpi is different allocation where 1 “count” equals “x” amount of bits or bytes, we need to create a calculation and set a yaxis unit appropriate to visualize it correctly.
Example in timelion:
.es(index=kpis*, q='Hostname.keyword:ns1.example.net', metric=avg:ROOTPARTITIONSIZE).multiply(4096).yaxis(units=bytes).lines(width=1,fill=0.5).color(#AED6F1).label("Root Partition Size"),.es(index=kpis*, q='Hostname.keyword:ns1.example.net', metric=avg:ROOTPARTITIONUSED).multiply(4096).yaxis(units=bytes).lines(width=1,fill=0.5).color(#DAF7A6).label("Root Partition Size"),
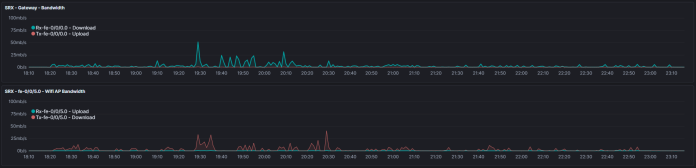
When it comes to interface tx and rx rates, we also need to perform some calculations to get things “looking” right. I am NOT polling at a very granular rate at the moment (every 15 minutes) so if there are bursts or drops in traffic during that interval, it will get averaged out. Once the concept is proven, I would definitely increase the frequency the data is collected.
Anyways, since the ifIn/OutOctets (or their 64 bit equivalent, ifHCIn/OutOctets which I’d recommend if possible) are a (32bit in this case) counter, they are ever increasing. To determine the interface rate, you need to subtract the latest counter value, from the previous counter value over a set time interval, multiply it by 8 (because each counter represents an octet/8 bits), and divide it by that interval.
Example:
IntervalValue2 – IntervalValue1 *8 / timeBetweenIntervals
[user@ns1 dberry]# while true; do date; snmpwalk -ctest -v2c localhost ifInOctets.2; sleep 60; done
Sun Oct 20 21:41:25 EDT 2019
IF-MIB::ifInOctets.2 = Counter32: 3613633761
Sun Oct 20 21:42:25 EDT 2019
IF-MIB::ifInOctets.2 = Counter32: 3613699361

[user@ns1 dberry]# interval1Value=3613633761
[user@ns1 dberry]# interval2Value=3613699361
[user@ns1 dberry]# timeElapsed=60
[user@ns1 dberry]# echo $((interval2Value-interval1Value))
65600
[user@ns1 dberry]# echo $((65600*8))
524800
[user@ns1 dberry]# echo $((524800/timeElapsed))
8746
From this it appears the estimate of rx on that interface was about 8.7Kbps
Running nload at the same time was pretty close:
Curr: 8.70 kBit/s
Avg: 11.02 kBit/s
Min: 6.29 kBit/s
Max: 78.49 kBit/s
Ttl: 3.37 GByte
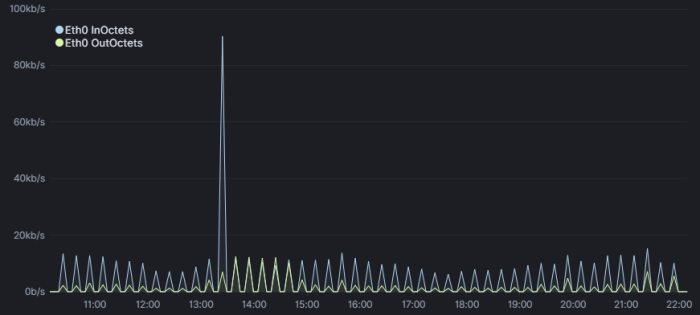
So how do we tackle that in a Kibana visualization? After much experimentation I settled on the below for now. If/when I increase the frequency of the data collection, I’d likely need to adjust the moving average (mvavg) value to match:
.es(index=kpis*, q='Hostname.keyword:ns1.example.net', metric=sum:ETH0IFINOCTETS).multiply(8).mvavg(15m).derivative().yaxis(units=bits/s).lines(width=1,fill=0.5).color(#AED6F1).label("Eth0 InOctets").scale_interval(1s),.es(index=kpis*, q='Hostname.keyword:ns1.berry.net', metric=sum:ETH0IFOUTOCTETS).multiply(8).mvavg(15m).derivative().yaxis(units=bits/s).lines(width=1,fill=0.5).color(#DAF7A6).label("Eth0 OutOctets").scale_interval(1s),
(The 90Kbps spike is when I did a yum install for nload)