
Part I
I noticed continual failed login attempts from random users and IPs. I’d already disabled root login, and enabled two factor authentication for specific users, so I wasn’t too concerned. I have to say, whomever is behind this is very determined.
root@junos% tail -f messages
Sep 1 20:51:21 junos sshd[75801]: Failed password for neel from 190.98.xx.xx port 60586 ssh2
Sep 1 20:51:21 junos sshd[75802]: Received disconnect from 190.98.xx.xx: 11: Bye Bye
Sep 1 20:51:29 junos sshd[75803]: Failed password for switch from 115.159.xx.xxport 35762 ssh2
Sep 1 20:51:29 junos sshd[75804]: Received disconnect from 115.159.xx.xx: 11: Bye Bye
Sep 1 20:51:29 junos sshd[75805]: Failed password for user from 105.73.xx.xx port 15458 ssh2
Sep 1 20:51:29 junos sshd[75806]: Received disconnect from 105.73.xx.xx: 11: Bye Bye
Sep 1 20:51:41 junos sshd[75807]: Failed password for nagios from 58.227.xx.xx port 12952 ssh2
Sep 1 20:51:41 junos sshd[75808]: Received disconnect from 58.227.xx.xx: 11: Bye Bye
Since I’m mildly curious if the IPs these originate from have any correlation (likely not since using jumps/proxies to hide ones origin is par for the course since forever), and I am wondering what pattern there may be to the usernames used, I’m going to track these in Elastic.
Remote Syslog in Juniper
This is relatively straight forward.
Send all logs/facilities at all severities (probably overkill and I’ll trim this back later):
set system syslog host 192.168.xx.xx any any
Specify the port:
set system syslog host 192.168.xx.xx port 1514
Once the change is committed, packet sniff on the receiver to confirm packets arrive.
[user@logstash ]# tcpdump -ni any -s0 -c10 -vv port 1514

...

22:52:56.432485 IP (tos 0x0, ttl 64, id 9122, offset 0, flags [none], proto UDP (17), length 126)
192.168.xx.xxx.syslog > 192.168.xx.xx.fujitsu-dtcns: [udp sum ok] SYSLOG, length: 98
Facility auth (4), Severity info (6)
Msg: Sep 1 22:52:56 sshd[77131]: Failed password for webmaster from 212.112.xxx.xx port 58044 ssh2
Syslog Pipeline
This is fairly straight forward. There are generally two types of sshd message formats.
The failed or successful login attempt:
Sep 1 20:51:21 junos sshd[75801]: Failed password for neel from 190.98.xx.xx port 60586 ssh2

Sep 1 20:52:03 junos sshd[75809]: Accepted publickey for xxxxxxxx from 192.168.xx.xx port 64316 ssh2
And, the disconnect:
Sep 1 20:51:21 junos sshd[75802]: Received disconnect from 190.98.xx.xx: 11: Bye Bye
One thing that’s easy enough to do is start with a grok filter for the whole message, just to see how it looks once it arrived. The above is straight from /var/log/messages, however it arrives looking like the below, which is almost the same minus the hostname:
<38>Sep 1 21:32:54 sshd[76288]: Failed password for eas from 103.228.112.45 port 58930 ssh2
The below grok patterns worked fine for my purposes:
#Login attempts
%{SYSLOGTIMESTAMP:syslog_timestamp} %{DATA:syslog_program}(?:\[%{POSINT:syslog_pid}\])?: %{GREEDYDATA:syslog_message} for %{USER:ident} from %{IPORHOST:clientip} port %{POSINT:port} %{WORD:protocol}
#Disconnects
%{SYSLOGTIMESTAMP:syslog_timestamp} %{DATA:syslog_program}(?:\[%{POSINT:syslog_pid}\])?: %{GREEDYDATA:syslog_message} from %{IPORHOST:clientip}: %{POSINT:session}: (?<Response>%{WORD} %{WORD})
Here’s the entire config. Note: I’ve left the message field in for now but to clean things up I’ll use the below after the grok pattern match:
mutate {

   remove_field => ["message"]

             }
Here is the entire syslog pipeline config:
input {
tcp {
port => 1514
type => syslog
}
udp {
port => 1514
type => syslog
}
}

filter {
if [type] == "syslog" {
grok {
match => {
"message" => [
"%{SYSLOGTIMESTAMP:syslog_timestamp} %{DATA:syslog_program}(?:\[%{POSINT:syslog_pid}\])?: %{GREEDYDATA:syslog_message} for %{USER:ident} from %{IPORHOST:clientip} port %{POSINT:port} %{WORD:protocol}",
"%{SYSLOGTIMESTAMP:syslog_timestamp} %{DATA:syslog_program}(?:\[%{POSINT:syslog_pid}\])?: %{GREEDYDATA:syslog_message} from %{IPORHOST:clientip}: %{POSINT:session}: (?<Response>%{WORD} %{WORD})"
]
}
}
date {
match => [ "syslog_timestamp", "MMM d HH:mm:ss", "MMM dd HH:mm:ss" ]
}
}
}

output {
elasticsearch {
hosts => ["localhost:9200"]
index => "%{type}-%{+YYYY.MM.dd}"
}
stdout { codec => rubydebug }
}
journalctl -f -u logstash
Sep 01 22:30:42 logstash.xx.net logstash[12107]: "message" => "<38>Sep 1 22:30:42 sshd[76895]: Failed password for user from 81.174.xx.xx port 33786 ssh2",
Sep 01 22:30:42 logstash.xx.net logstash[12107]: "ident" => "user",
Sep 01 22:30:42 logstash.xx.net logstash[12107]: "type" => "syslog",
Sep 01 22:30:42 logstash.xx.net logstash[12107]: "clientip" => "81.174.xx.xx",
Sep 01 22:30:42 logstash.xx.net logstash[12107]: "protocol" => "ssh2",
Sep 01 22:30:42 logstash.xx.net logstash[12107]: "host" => "192.168.xx.xxx",
Sep 01 22:30:42 logstash.xx.net logstash[12107]: "syslog_pid" => "76895",
Sep 01 22:30:42 logstash.xx.net logstash[12107]: "syslog_timestamp" => "Sep 1 22:30:42",
Sep 01 22:30:42 logstash.xx.net logstash[12107]: "syslog_program" => "sshd",
Sep 01 22:30:42 logstash.xx.net logstash[12107]: "port" => "33786",
Sep 01 22:30:42 logstash.xx.net logstash[12107]: "@version" => "1",
Sep 01 22:30:42 logstash.xx.net logstash[12107]: "@timestamp" => 2019-09-02T02:30:42.000Z,
Sep 01 22:30:42 logstash.xx.net logstash[12107]: "syslog_message" => "Failed password"
Sep 01 22:30:42 logstash.xx.net logstash[12107]: }
I’ll update this further once I’ve collected data over some time and have some visualizations to share.
Part II
I realize that this data is going to be much more interesting if I map the external IPs (clientip value after parsing) to a geoip map.
This is pretty straight forward with the below addition to the end of the filter section of the pipeline, after downloading and adding the geo ip database.:
 geoip {
source => "clientip"
database => "/etc/logstash/geoipdbs/GeoLite2-City.mmdb"
}
For reference, here’s the whole pipeline:
input {
tcp {
port => 1514
type => syslog
}
udp {
port => 1514
type => syslog
}
}

filter {
if [type] == "syslog" {
grok {
match => {
"message" => [
"%{SYSLOGTIMESTAMP:syslog_timestamp} %{DATA:syslog_program}(?:\[%{POSINT:syslog_pid}\])?: %{GREEDYDATA:syslog_message} for %{USER:ident} from %{IPORHOST:clientip} port %{POSINT:port} %{WORD:protocol}",
"%{SYSLOGTIMESTAMP:syslog_timestamp} %{DATA:syslog_program}(?:\[%{POSINT:syslog_pid}\])?: %{GREEDYDATA:syslog_message} from %{IPORHOST:clientip}: %{POSINT:session}: (?<Response>%{WORD} %{WORD})"
]
}
}
date {
match => [ "syslog_timestamp", "MMM d HH:mm:ss", "MMM dd HH:mm:ss" ]
}
}
geoip {
source => "clientip"
database => "/etc/logstash/geoipdbs/GeoLite2-City.mmdb"
}
}

output {
elasticsearch {
hosts => ["localhost:9200"]
index => "%{type}-%{+YYYY.MM.dd}"
}
stdout { codec => rubydebug }
}
After restarting logstash, we get some nice detail on the location of these IPs:
Sep 02 20:30:28 logstash.xx.net logstash[15553]: "clientip" => "139.59.xx.xxx",
Sep 02 20:30:28 logstash.xx.net logstash[15553]: "ident" => "team4",
Sep 02 20:30:28 logstash.xx.net logstash[15553]: "port" => "51958",
Sep 02 20:30:28 logstash.xx.net logstash[15553]: "@version" => "1",
Sep 02 20:30:28 logstash.xx.net logstash[15553]: "syslog_program" => "sshd",
Sep 02 20:30:28 logstash.xx.net logstash[15553]: "type" => "syslog",
Sep 02 20:30:28 logstash.xx.net logstash[15553]: "protocol" => "ssh2",
Sep 02 20:30:28 logstash.xx.net logstash[15553]: "syslog_pid" => "89840",
Sep 02 20:30:28 logstash.xx.net logstash[15553]: "geoip" => {
Sep 02 20:30:28 logstash.xx.net logstash[15553]: "latitude" => 12.9833,
Sep 02 20:30:28 logstash.xx.net logstash[15553]: "country_code2" => "IN",
Sep 02 20:30:28 logstash.xx.net logstash[15553]: "city_name" => "Bengaluru",
Sep 02 20:30:28 logstash.xx.net logstash[15553]: "country_code3" => "IN",
Sep 02 20:30:28 logstash.xx.net logstash[15553]: "timezone" => "Asia/Kolkata",
Sep 02 20:30:28 logstash.xx.net logstash[15553]: "continent_code" => "AS",
Sep 02 20:30:28 logstash.xx.net logstash[15553]: "region_name" => "Karnataka",
Sep 02 20:30:28 logstash.xx.net logstash[15553]: "location" => {
Sep 02 20:30:28 logstash.xx.net logstash[15553]: "lon" => 77.5833,
Sep 02 20:30:28 logstash.xx.net logstash[15553]: "lat" => 12.9833
Sep 02 20:30:28 logstash.xx.net logstash[15553]: },
Sep 02 20:30:28 logstash.xx.net logstash[15553]: "longitude" => 77.5833,
Sep 02 20:30:28 logstash.xx.net logstash[15553]: "postal_code" => "560100",
Sep 02 20:30:28 logstash.xx.net logstash[15553]: "region_code" => "KA",
Sep 02 20:30:28 logstash.xx.net logstash[15553]: "country_name" => "India",
Sep 02 20:30:28 logstash.xx.net logstash[15553]: "ip" => "139.59.xx.xxx"
Sep 02 20:30:28 logstash.xx.net logstash[15553]: },
Too early to say if there’s a pattern, and these are likely compromised servers/proxies anyways.
[user@logstash ]# journalctl -f -u logstash |grep city_name
Sep 02 20:36:57 logstash.xx.net logstash[15553]: "city_name" => "Moscow",
Sep 02 20:36:57 logstash.xx.net logstash[15553]: "city_name" => "Moscow",
Sep 02 20:36:57 logstash.xx.net logstash[15553]: "city_name" => "Moscow",
Sep 02 20:36:57 logstash.xx.net logstash[15553]: "city_name" => "Moscow",
Sep 02 20:36:57 logstash.xx.net logstash[15553]: "city_name" => "Moscow",
Sep 02 20:36:57 logstash.xx.net logstash[15553]: "city_name" => "Moscow",
Sep 02 20:36:57 logstash.xx.net logstash[15553]: "city_name" => "Moscow",
Sep 02 20:36:58 logstash.xx.net logstash[15553]: "city_name" => "Moscow",
Sep 02 20:37:55 logstash.xx.net logstash[15553]: "city_name" => "San Francisco",
Sep 02 20:37:55 logstash.xx.net logstash[15553]: "city_name" => "San Francisco",
Sep 02 20:37:55 logstash.xx.net logstash[15553]: "city_name" => "San Francisco",
Sep 02 20:37:55 logstash.xx.net logstash[15553]: "city_name" => "San Francisco",
Sep 02 20:37:55 logstash.xx.net logstash[15553]: "city_name" => "San Francisco",
Sep 02 20:37:55 logstash.xx.net logstash[15553]: "city_name" => "San Francisco",
Sep 02 20:37:55 logstash.xx.net logstash[15553]: "city_name" => "San Francisco",
Sep 02 20:39:59 logstash.xx.net logstash[15553]: "city_name" => "Dhaka",
Sep 02 20:39:59 logstash.xx.net logstash[15553]: "city_name" => "Dhaka",
Sep 02 20:39:59 logstash.xx.net logstash[15553]: "city_name" => "Dhaka",
Sep 02 20:39:59 logstash.xx.net logstash[15553]: "city_name" => "Dhaka",
Sep 02 20:40:00 logstash.xx.net logstash[15553]: "city_name" => "Dhaka",
Sep 02 20:40:00 logstash.xx.net logstash[15553]: "city_name" => "Dhaka",
Sep 02 20:40:00 logstash.xx.net logstash[15553]: "city_name" => "Dhaka",
Sep 02 20:41:59 logstash.xx.net logstash[15553]: "city_name" => "Bengaluru",
Sep 02 20:44:28 logstash.xx.net logstash[15553]: "city_name" => "Bengaluru",
Sep 02 20:44:28 logstash.xx.net logstash[15553]: "city_name" => "Bengaluru",
Sep 02 20:44:28 logstash.xx.net logstash[15553]: "city_name" => "Bengaluru",
Sep 02 20:44:28 logstash.xx.net logstash[15553]: "city_name" => "Bengaluru",
Sep 02 20:44:29 logstash.xx.net logstash[15553]: "city_name" => "Bengaluru",
Sep 02 20:44:29 logstash.xx.net logstash[15553]: "city_name" => "Bengaluru",
Sep 02 20:44:29 logstash.xx.net logstash[15553]: "city_name" => "Bengaluru",
Sep 02 20:44:29 logstash.xx.net logstash[15553]: "city_name" => "Bengaluru",
Next, let’s visualize these…
If we tried in this current state, we’d see the below error stating there is no geo_point field in our index:
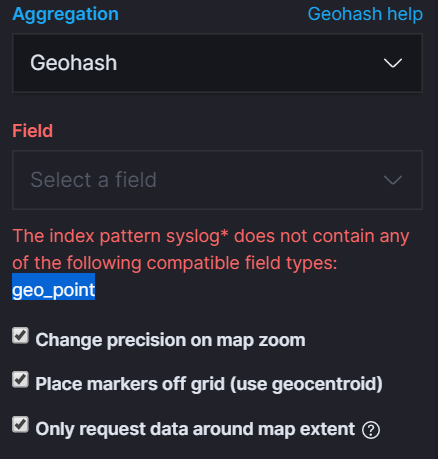
In order to do that, we’ll need to update our index mapping fields to create a geo_point. That is a field with geoip location from both the longitude and latitude. Ie;
Sep 02 20:30:28 logstash.xx.net logstash[15553]: "geoip" => {
Sep 02 20:30:28 logstash.xx.net logstash[15553]: "latitude" => 12.9833,

...

Sep 02 20:30:28 logstash.xx.net logstash[15553]: "longitude" => 77.5833,

...

Sep 02 20:30:28 logstash.xx.net logstash[15553]: "location" => {
Sep 02 20:30:28 logstash.xx.net logstash[15553]: "lon" => 77.5833,
Sep 02 20:30:28 logstash.xx.net logstash[15553]: "lat" => 12.9833
Sep 02 20:30:28 logstash.xx.net logstash[15553]: },
What is convenient about these fields automatically created when we use the geoip plugin source of the clientip, is that the location field itself contains both lon and lat floats already. All we really need to do is map geoip.location -> geo_point.
This is the easiest way. Create a new template for the index pattern, with the mapping we need (note: as of Elasticsearch 7.x, there is no longer a type field in templates, so if you try and define one you’ll get an error):
PUT _template/syslog
{
"index_patterns": [
"syslog*"
],
"mappings": {
"properties": {
"geoip.location": {
"type": "geo_point"
}
}
}
}
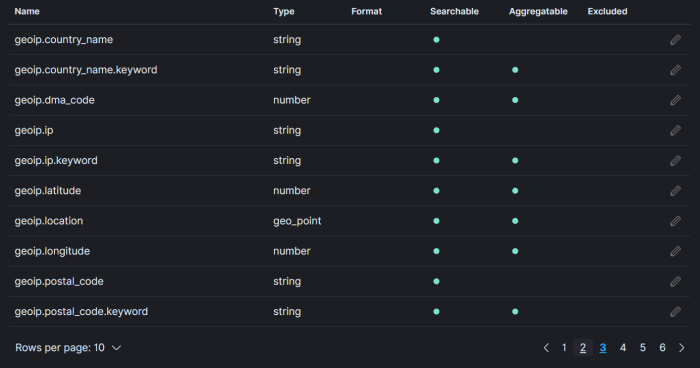
Since this would only be applied at index creation, you’ll need to delete the old indices after applying the template. Once done, refresh the index pattern and you should see that the geo.location field is a geo_point type.
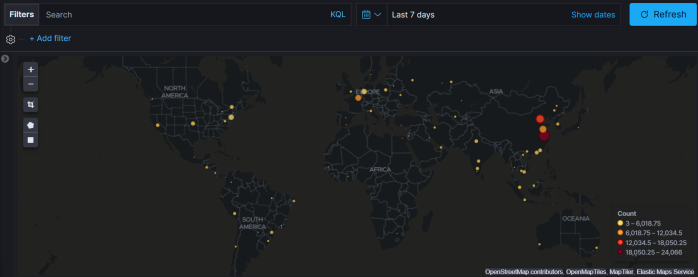
Now, we can visualize all the geoip locations:
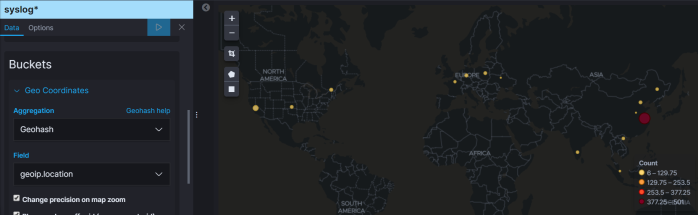
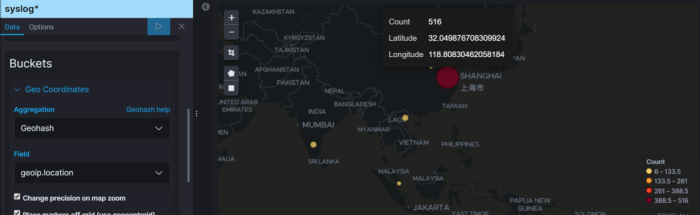
I “seem” to be very popular in China. Over 500 hits in the past hour:
Part III
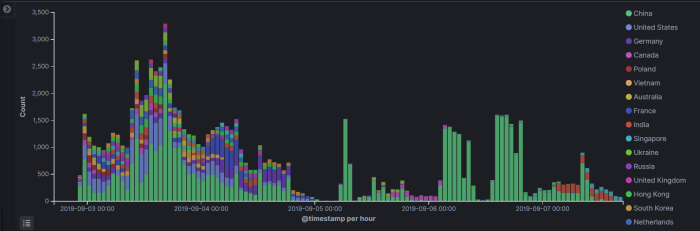
In summary, after collecting data for only 5 days, here are some totals.
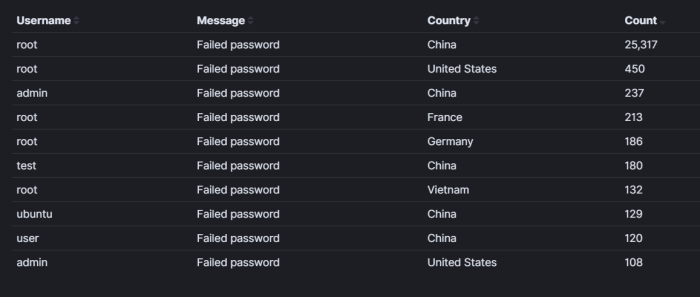
Although these attempts are globally distributed (typical botnet), there is definitely a higher, continual attempt rate from China. Over 25k total over 5 days:
Trying to login as root is definitely priority #1.
Solution:
I considered setting up a honey pot just to see what someone would do if they gained access, however the risk of being blamed for anything the left the honeypot (such as a DNS amplification attack) I felt was too great. Also, the only safe way to do this is by ensuring the honey pot can’t reach anything else local on my system, however to review the captures and logs afterwards they’d need to be transferred somewhere. The ambiguity of transferring whatever malicious code attempts are made may also be misinterpreted as originating from me.
Instead, change ssh to another port other than 22, and limit access to only certain subnets.
If this were a linux system, changing the ssh port in sshd, and setting hosts.allow for only local IPs and/or limited subnets would be a start. Fail2Ban would be a good second line of defense.
In juniper/junos, I’ll make a firewall filter and then apply that filter to whichever interface(s) are applicable. In the case of ssh, blocking it at the loopback address will keep these ssh attempts from reaching the control plane.
- create the accept filter:
set firewall filter RESTRICT-SSH term SSH-ACCEPT from source-address 192.168.xx.x/24

set firewall filter RESTRICT-SSH term SSH-ACCEPT from protocol tcp

set firewall filter RESTRICT-SSH term SSH-ACCEPT from destination-port ssh

set firewall filter RESTRICT-SSH term SSH-ACCEPT then accept
- create the reject filter:
set firewall filter RESTRICT-SSH term SSH-REJECT then reject

set firewall filter RESTRICT-SSH term SSH-REJECT then count MALICIOUS-ATTEMPT

set firewall filter RESTRICT-SSH term SSH-REJECT then log

set firewall filter RESTRICT-SSH term SSH-REJECT then syslog
- Apply the filter to lo0:
set interfaces lo0 unit 0 family inet filter input RESTRICT-SSH
- Commit confirmed and test from another device from a network NOT in the source-address list in SSH-ACCEPT. One the test is complete, issue another commit else the config will roll back.
user@junos# commit confirmed 2
commit confirmed will be automatically rolled back in 2 minutes unless confirmed
commit complete

# commit confirmed will be rolled back in 5 minutes
[edit firewall]
user@junos# commit
commit complete

[edit firewall]
Confirmation:
[someuser@elastiflow ]# ssh someuser@192.168.xx.xxx
ssh: connect to host 192.168.xx.xxx port 22: No route to host
Since I chose to log the attempts, next I’ll parse these in logstash and see how long it takes for these attempts to stop:
<158>Sep 7 21:39:35 junos1 PFE_FW_SYSLOG_IP: FW: fe-0/0/0.0 R tcp 49.88.xxx.xxx xx.xx.xx.xx 32160 22 (1 packets)
note: after applying this I remembered that snmp polling also needs to reach the control plane of my juniper SRX, so I had to amend the accept filter to allow udp and snmp as well:
set firewall filter RESTRICT-SSH term SSH-ACCEPT from source-address 192.168.xx.x/24
set firewall filter RESTRICT-SSH term SSH-ACCEPT from protocol tcp
set firewall filter RESTRICT-SSH term SSH-ACCEPT from protocol udp
set firewall filter RESTRICT-SSH term SSH-ACCEPT from destination-port ssh
set firewall filter RESTRICT-SSH term SSH-ACCEPT from destination-port snmp
set firewall filter RESTRICT-SSH term SSH-ACCEPT then accept
